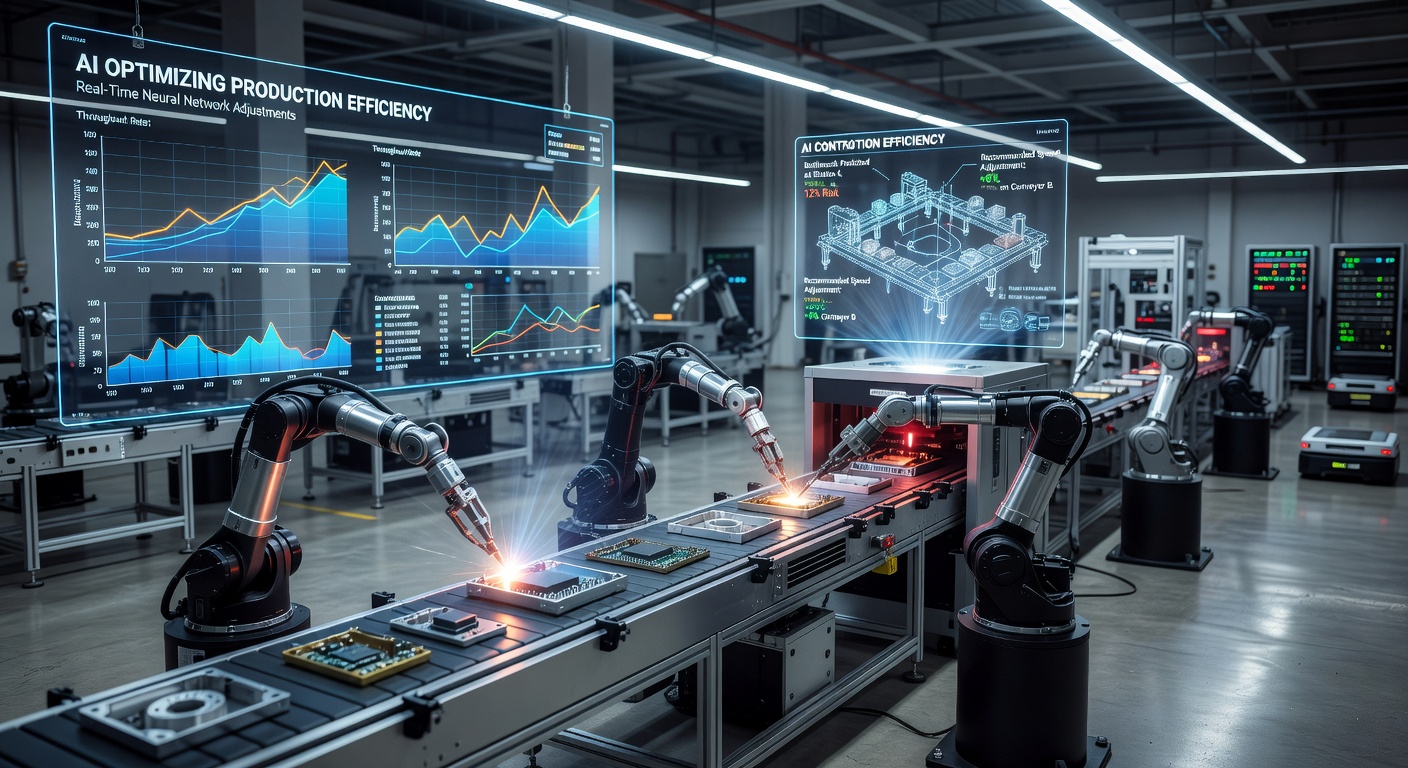
Transform raw production data into actionable intelligence. VisionForge's process analytics platform monitors every second of your operation, identifying waste, bottlenecks, and improvement opportunities automatically.
Vision systems track availability, performance, and quality in real time β giving you a single source of truth for continuous improvement initiatives.
Vision-based downtime classification distinguishes planned stops, changeovers, breakdowns, and idle time automatically β no manual logging required.
Camera systems track cycle times per station, identify micro-stoppages, and flag speed losses with timestamp precision to the millisecond.
100% visual inspection at line speed eliminates sampling-based quality assumptions and provides real first-pass yield data continuously.
VisionForge's Line Intelligence Platform maps camera feeds to your production layout, tracking flow, accumulation, and station-level performance across every shift without manual data collection.
Visual flow analysis pinpoints constraint stations, buffer build-up zones, and starved workstations.
Break down every cycle into process, wait, transport, and non-value-added time β automatically.
Video analysis of changeover activities identifies wasted motion, incorrect sequences, and tooling inefficiencies.
Our neural network training production models learn the rhythms, patterns, and anomalies of your specific production environment β going beyond simple metrics to understand causality.
AI correlates quality events, downtime, and throughput changes to identify root causes across your entire value stream.
Weekly AI-generated improvement reports ranked by ROI potential, ready to feed directly into your Lean and Six Sigma programmes.
Compare shift, line, and site performance across your UK manufacturing estate.
Track WIP movement, accumulation points, and transport routes to eliminate material handling waste.
Anonymous worker motion analysis identifies ergonomic issues and non-value-added activity patterns.
Video-based SMED analysis reduces changeover durations by capturing every action in detail.
Visual counting and buffer monitoring eliminates overproduction and excessive WIP accumulation.
Process activity correlation with energy consumption identifies opportunities to reduce kWh per unit.
PPE detection, exclusion zone monitoring, and unsafe act identification for HSE compliance.